Find the firewall problem behind the helpdesk ticket.

Firewall Fleet Health puts every Palo Alto Networks firewall, tunnel and SD-WAN path in your fleet in one dashboard, alongside Panorama or without it. Pick a ticket and watch it get answered.

Helpdesk stories

Ticket #4471 · Tier 1 · 9:12 AM
Users in Dayton say Teams keeps freezing. Is it just them?

Not just Dayton. Six sites, one cause.

Every complaining site shares one hub, and that hub is where the loss is.

Chicago-DC hub: 4% packet loss on ISP 16 branch sites affected · since 8:41 AM
  • Dayton
  • Akron
  • Lansing
  • Grand-Rapids
  • Joliet
  • Peoria

The loss started at 8:41 and it's only on ISP 1.

Daily and 5-minute history for every public link, so you see when it started and which link it is on.

30 days agoToday 8:41 AM
  • normal
  • packet loss: 1 day

The NOC already knows.

Fleet-wide degradation goes straight to the people who fix it, on the channel they picked.

  • Degraded: Chicago-DC hub, ISP 1 4% loss, 6 sites affected Microsoft Teams · #network-ops · 8:43 AM
  • Same alert Email to on-call engineer email · on-call engineer · 8:43 AM

Tier 1 tells the next caller in ten seconds.

Known issue: Chicago-DC hub ISP 1 degraded Calls and Teams may stutter at 6 sites. Carrier ticket open, next update 10:00. Posted by J. Ruiz, network engineering, 8:55 AM

One ticket. One cause. Zero escalations.
Ticket #4482 · Tier 1 · 1:37 PM
Omaha says the internet is crawling. Can someone look?

Still clicking through the console? We already found it.

Hunting in the console

  1. Pick the device group
  2. Open the activity view, wait
  3. Change the time range, wait
  4. Filter by source zone…

Omaha: Windows Update is using 212 Mbps

windows-update 212 Mbps
ms-teams 14 Mbps
ssl 10 Mbps
zoom 6 Mbps

212 Mbps across 41 sessions since 1:02 on the 250 Mbps link.

Bandwidth by application for every site, kept as 5-minute detail for 7 days.

Omahabandwidth by application

Windows Update is using 212 Mbps

windows-update 212 Mbps
ms-teams 14 Mbps
ssl 10 Mbps
zoom 6 Mbps

Link capacity 250 Mbps · 41 sessions · since 1:02 PM

Not an outage. A patch window. Ticket closed in four minutes.

Ticket #4490 · Tier 2 · Thu 9:44 AM
Memphis dropped again. It did this last Thursday too.

Every Thursday, around 9:40.

30 days of tunnel status at a glance. The Memphis tunnels drop on every Thursday in the window.

30 days agoThu (today)
  • normal
  • tunnel down: 5 days

It started seven weeks ago. Never before.

The collector keeps 18 months of firewall events. With the event log set to look back 18 months, Memphis WAN link-down events start seven weeks ago, every Thursday since.

First link-down: 7 weeks ago

18 months ago12 months6 monthsToday
  • other events
  • Memphis WAN link-down

A change from that same week.

With config changes set to the last 90 days and Memphis-850 picked, one change lands that same week.

Memphis-850 · QoS policy rule "Backup-Window"Added by m.chen · 7 weeks ago
added schedule: Thu 09:30–10:30 "backup-window"
added source: backup-server destination: any
added class: 1

Found in one sitting: a weekly QoS rule starving the tunnel.

Ticket #4495 · Tier 1 · 8:20 AM
Columbus can't reach the file server since this morning.

Only Columbus. The hubs are fine.

Only one site is affected and the hubs are fine. So it's local, and Tier 1 can say so straight away.

Columbus: HA pair failed over at 8:12Passive unit now active · config not in sync
  • Columbus

The new active unit is missing last night's change.

Columbus-850a ↔ Columbus-850bHA failover 8:12 AM · now active: Columbus-850b

Columbus-850a

was active

Last commit11:48 PM by d.patel

Columbus-850b

now active

Last commitdoes not have the 11:48 PM commit

Config not in sync with peer · failover at 8:12 AM

Escalated with the cause attached: the pair is out of sync.

Walk-up · Helpdesk lead · 2:05 PM
Phones are ringing off the hook. Is something down?

35 of 36 firewalls healthy.

The whole fleet on one screen, built for people who aren't firewall engineers.

  • 35 healthy
  • needs attention: Laredo

And engineering already posted why.

Known issue: Laredo primary internet down Carrier fiber cut; running on the backup link, ETA 4:00 PM. Other sites unaffected. Posted by network engineering, 1:58 PM

Nothing widespread. The calls are about something else.

Three questions that eat the morning

  • Which site is broken, and what's eating the link?

    In a management console the answer takes several steps per device group and time range, and you start again for the next site.

  • Has this SD-WAN path been flaky all month?

    Per-path SD-WAN latency, jitter and loss history is the kind of view usually sold as a premium cloud add-on. Here it is included, kept as daily trends for 13 months.

  • Is it just this caller?

    Tier 1 can't tell a one-off from a fleet-wide problem, so every call gets escalated.

Still clicking through the console? We already found it.

Hunting in the console

  1. Pick the device group
  2. Open the activity view, wait
  3. Change the time range, wait
  4. Filter by source zone…

Omaha: Windows Update is using 212 Mbps

windows-update 212 Mbps
ms-teams 14 Mbps
ssl 10 Mbps
zoom 6 Mbps

The screens your team will use

Real screens from the live demo (opens in a new tab), running against a made-up company's fleet of 36 firewalls.

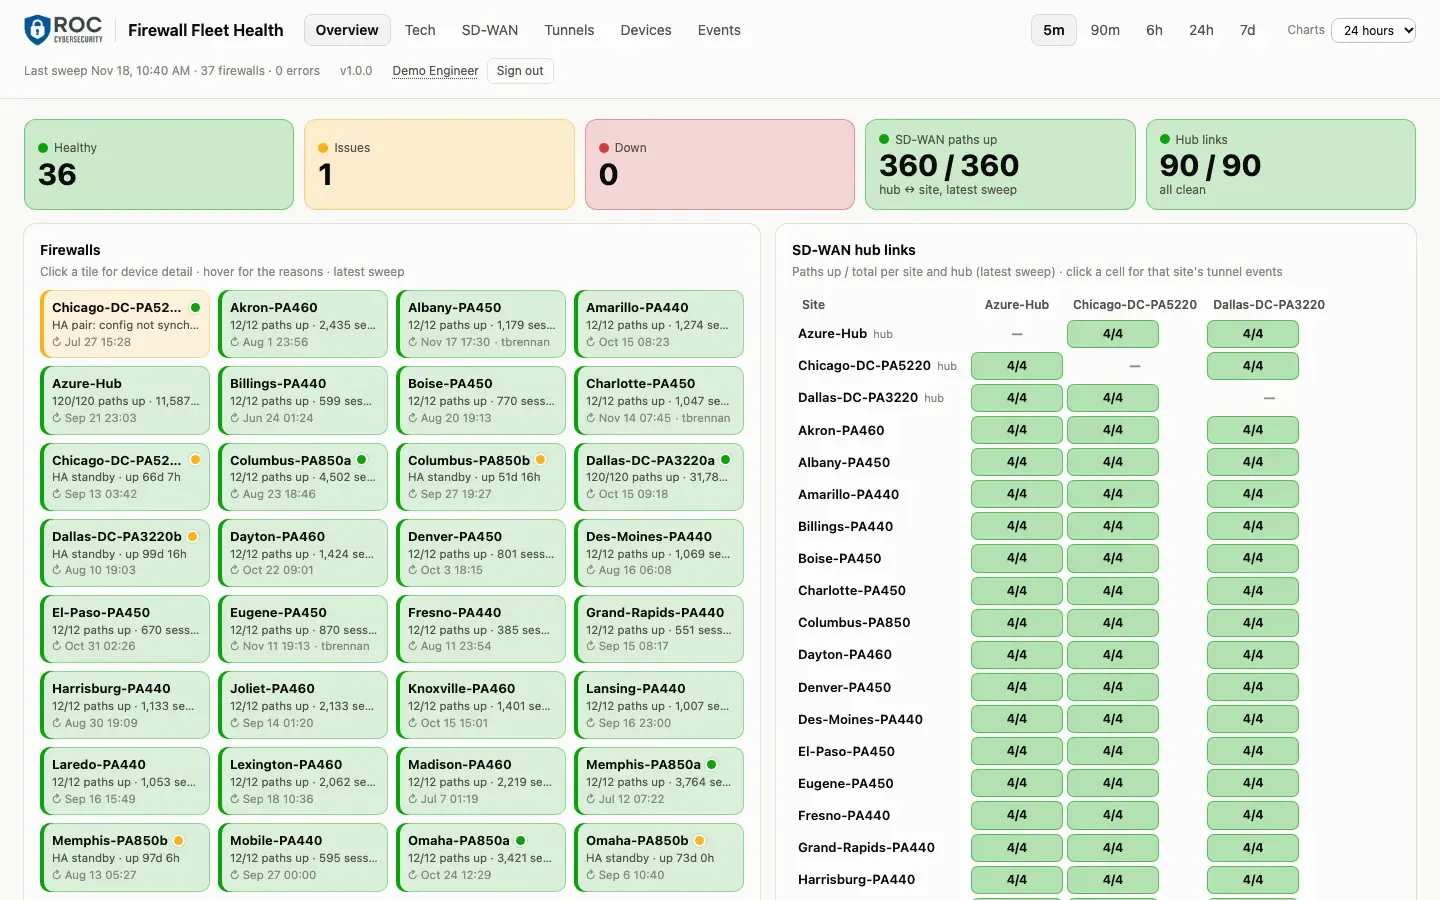
Overview screen: counts of healthy, issue and down firewalls, a tile per firewall, and a matrix of SD-WAN hub links per site.
Overview. Every firewall as a tile and every hub link in one matrix, so the single amber tile is the first thing you notice.
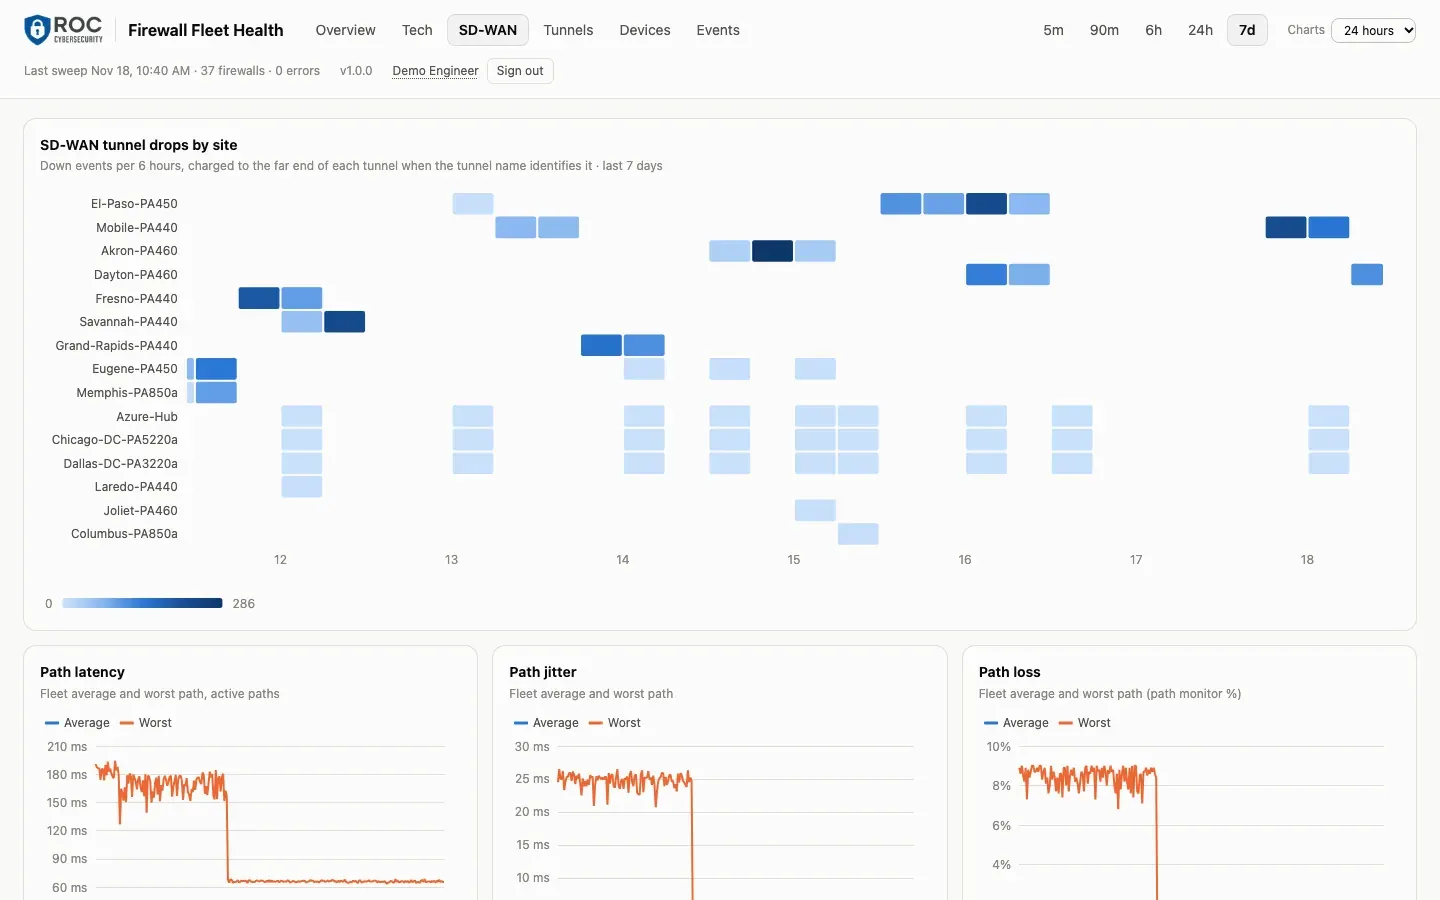
SD-WAN screen: a heatmap of tunnel drops by site over seven days, above charts of path latency, jitter and loss.
SD-WAN. Tunnel drops by site over the week, charged to the far end of each tunnel, with fleet latency, jitter and loss underneath.
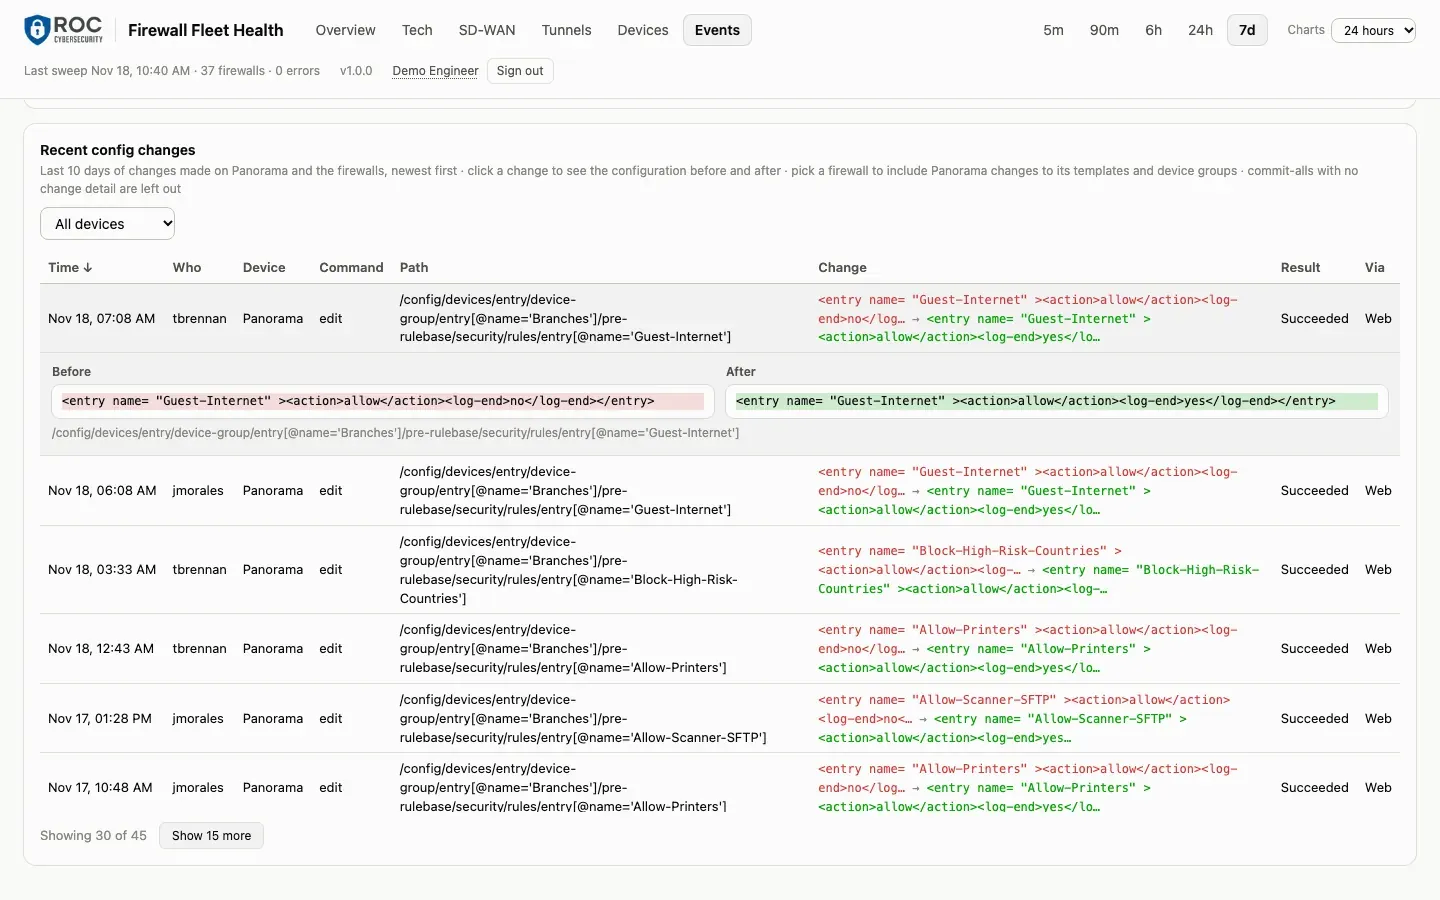
Recent config changes table with one change opened to show the configuration before and after.
Events. Who changed what and when, with the configuration before and after. Secrets are masked.
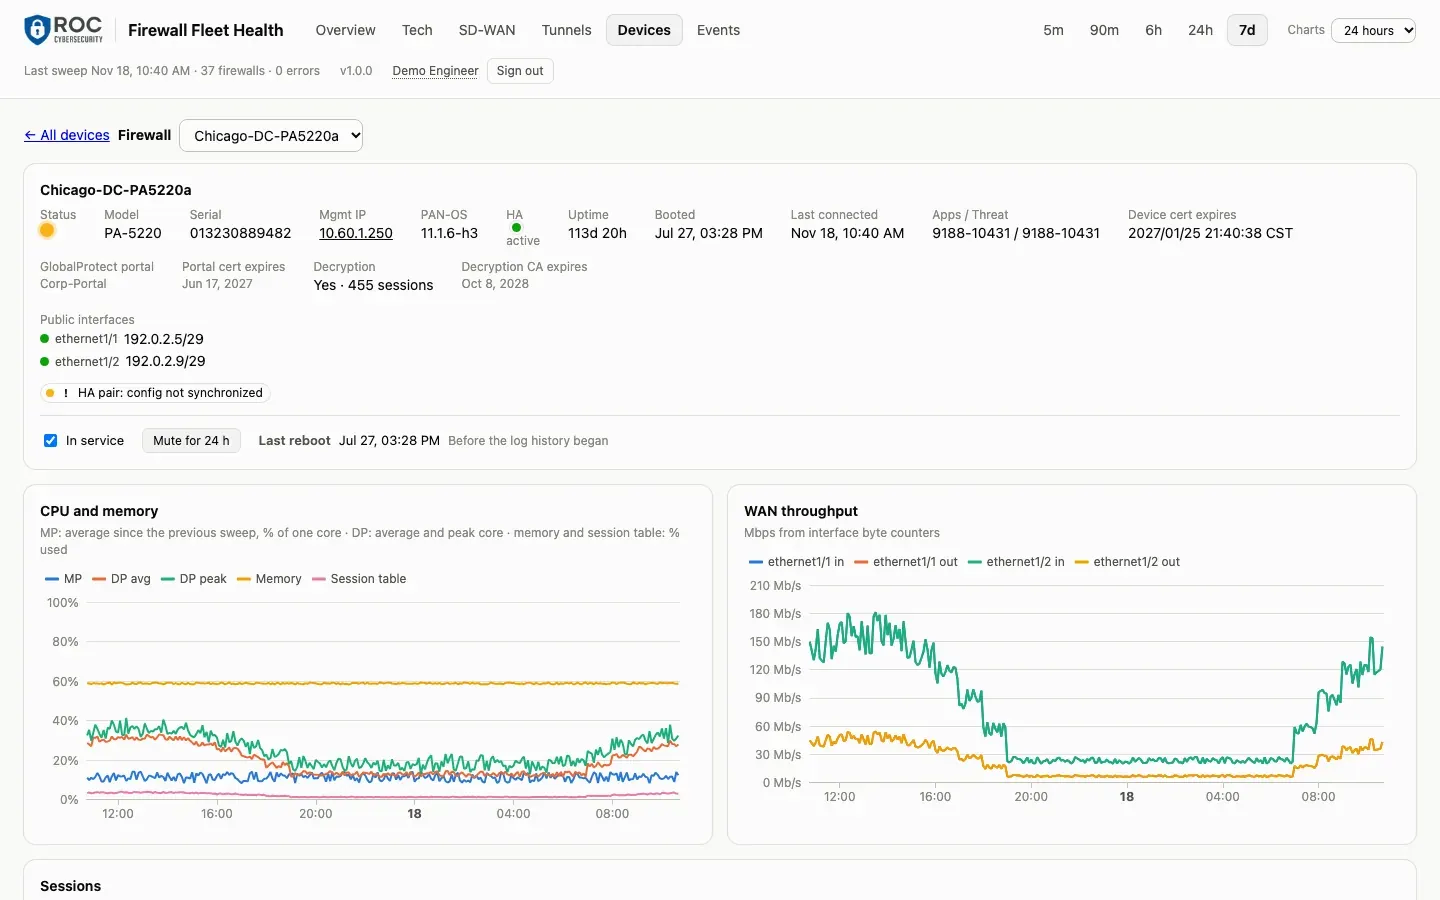
Device screen for a hub firewall: status, model, software version, HA state, last reboot, and charts of CPU, memory and WAN throughput.
Device. One firewall in detail: HA state, uptime, last reboot, certificate expiry, CPU, memory and WAN throughput.
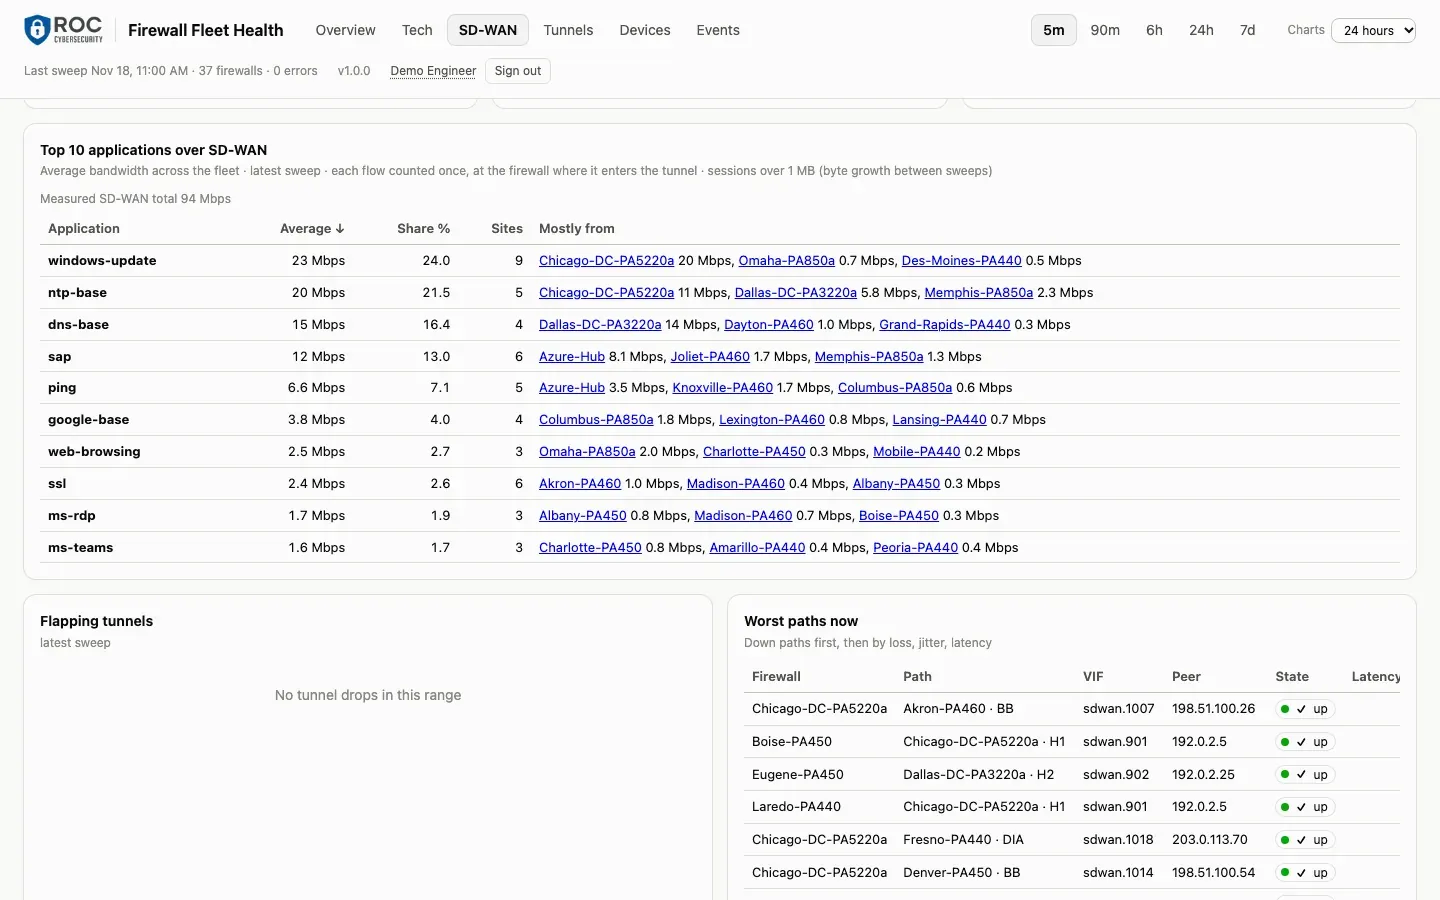
Top 10 applications over SD-WAN: average bandwidth, share and site count per application, with the sites sending the most.
Bandwidth by application. Which applications use the SD-WAN, how much each takes, and which sites they mostly come from.
Notifications. Outage and degradation alerts go out on Microsoft Teams, Slack, email or SMS.
Status banner. Engineers post the known issue across the top of the Overview, so Tier 1 can answer the next caller without escalating.

Answers that go back to last year

Some problems only show across months: a link that got a little worse every week all summer, a rule someone changed in March. The collector keeps the history so you can look.

Retention drawn to scale: 18 months of events across the full width, 13 months of daily trends as a heat grid, and the last 30 days and 7 days marked at the right edge. Events and config changes Daily trends 30 days 7 days 18 months ago 13 months ago today
  • 18 months of firewall events and config changesWho changed what and when, before and after, with secrets masked.
  • 13 months of daily trendsDaily average, low and high for every firewall, SD-WAN path, tunnel, BGP peer and WAN link.
  • 30 days of tunnel statusEvery SD-WAN tunnel drop and recovery, with hub-versus-site blame.
  • 7 days of 5-minute detailIncluding bandwidth by application, for the "what happened at 1:02?" questions.

So Tier 1 can answer the phone

The Overview is written for people who aren't firewall engineers. Roles for tech, engineer, admin and exec keep the controls with the people who should have them.

Overview at a glance
Healthy, issue and down counts for the whole fleet, and a tile per firewall that says what is wrong in plain words.
Status banner
Engineering posts the known issue once, and it sits across the top of every Overview screen.
Notifications
Outages and degradation go to Microsoft Teams, Slack, email and SMS.

How the helpdesk uses it

35 of 36 firewalls healthy.

The whole fleet on one screen, built for people who aren't firewall engineers.

  • 35 healthy
  • needs attention: Laredo

No Panorama? No problem.

Direct mode reads each firewall's own API in turn, with a read-only account, so a fleet without Panorama still gets one dashboard. If you do run Panorama, the tool reads through it and works alongside it.

Running without Panorama

The collector connects to eight branch firewalls one after another, and each turns green once it has been read. Collector read-only Akron Boise Dayton Eugene Fresno Joliet Laredo Mobile

Three ways to connect, or run it yourself

Pick whichever your security policy allows. The account is read-only, and the dashboard makes no changes to your firewalls.

Ways to connect Firewall Fleet Health to your firewalls
OptionWhat it takesBest for
IPsec tunnel to ROC One site-to-site IKEv2 tunnel from their firewall to ROC, a route for one ROC address, one security rule allowing it to Panorama on TCP 443. Nothing installed. Most Palo Alto shops
WireGuard tunnel box Run ROC's small container on a host that can reach Panorama; it connects out to ROC over UDP. Policy forbids vendor tunnels, or the firewall can't be changed
Direct over the internet Allow only ROC's public address to reach Panorama's (or the firewalls') API, with a security policy and allowlist. Fastest proof of concept
Self-hosted (Docker) Run the dashboard image on their own server with a ROC license; data never leaves their network. Data must stay in-house

How each option is set up

Try it on your own fleet

A proof of concept points Firewall Fleet Health at your own firewalls, so you can judge it against problems you already know about. Connecting directly over the internet is the quickest way to start.

Start a proof of concept

Questions people ask first

All questions and answers

Does Firewall Fleet Health work with Panorama?

Yes. It works alongside Panorama, reading fleet data through its API, and the dashboard never changes your configuration. If you do not run Panorama, direct mode reads each firewall's API instead.

How long is data kept?

18 months of firewall events and config changes, 13 months of daily trends, 30 days of tunnel status, and 7 days of 5-minute detail.

Does it make changes to our firewalls?

No. It signs in with a read-only account. You can mute a firewall or mark it out of service inside the dashboard, and those settings stay in the dashboard.

Where does it run?

ROC can host it for you, or you can run the Docker image on your own server with a ROC license so the data stays on your network.

Who is it for?

Network engineers who need to find the failing site, tunnel or link, and helpdesk staff who need to know whether a call is part of something bigger. Roles for tech, engineer, admin and exec decide who sees what.

How do people hear about an outage?

Notifications go to Microsoft Teams, Slack, email or SMS, and engineers can post a status banner on the Overview so the helpdesk can answer callers straight away.

See your own fleet this way

Book a walkthrough with ROC Cybersecurity, or click around the demo fleet right now.